Introduction
Farmers require rapid, cost-effective, green and non-destructive methods for monitoring changes in the physical and chemical properties of crops throughout the lifecycle of the plant with the goal to establish the optimum harvest time, to improve agronomic management practices and to improve crop diagnostics (Daniel Cozzolino, 2014; Kris-Etherton et al., 2004; Xu, Yu, Tesso, Dowell, & Wang, 2013). Most common chemical analysis methods are destructive requiring large sample sizes. The use of non-destructive methods for analyzing food products composition is more ideal considering the fact that the products are not destroyed and are therefore available for sale or consumption.
Infrared (IR) spectroscopy is becoming a preferred method of routine analysis, especially in agriculture. Agricultural materials have different chemical composition and internal physical structures, thus, they reflect, scatter, absorb, and emit electromagnetic energy in different ways at specific wavelengths. This property makes infrared (IR) spectroscopy applicable in the analysis of these products. These differences observed are characterized by a typical spectrum that is distict for each component. This can be considered as the spectral signature or spectral fingerprint of the material (Dale et al., 2013). Thus, infrared (IR) spectroscopy this method has been applied in agriculture for various analysis. Its growing popularity is due to its accuracy and efficiency of process (Roberts, Workman, & Reeves, 2004).
Results on the use of infrared spectroscopy have demonstrated the potential to predict the chemical composition of different forage plant species (García & Cozzolino, 2006), food products as well as non-food agricultural produce, especially those used as cash crops (Roberts et al., 2004). Remote and proximal sensor tools have been used recently to monitor different aspects of cereal production from planting to harvest and beyond. Most of them are based in near-infrared (NIR) spectroscopy (Daniel Cozzolino, 2014). Currently, its applications in agriculture not only include yield detection and component identification in plants, but also vegetation mapping, crop disease, stress and detection of impurities. There is also a growing interest in near-infrared hyperspectral imaging for safety and quality assessments of the agro-food products. The applications have been classified from the level of satellite images to the macroscopic or molecular level (Dale et al., 2013). According to Roberts et al., (2004), typical applications of infrared spectroscopy in agriculture include:
- Analysis of food crops
- Analysis of processed foods
- Analysis of non-food agricultural products
Applications in analysis of food crops
Improvements in crop and forage quality often entail screening of large numbers of samples, and this may limit the size of a plant breeding program. Near infrared reflectance (NIR) spectroscopy appears to be an attractive alternative to routine chemical analysis, resulting in substantial improvements in the efficiency of the breeding process for some aspects of quality such as protein and digestibility (García & Cozzolino, 2006). Most of these tools are characterized as non-destructive, non-invasive and easy-to-use, and most of them are based on near-infrared spectroscopy (Daniel Cozzolino, 2014). To achieve these functions, calibration should be done for each species, season and particular conditions (García & Cozzolino, 2006).
The following are the specific applications:
- Analysis of forages and feedstuffs – Measurement of rumen dry matter and neutral detergent fiber degradability of feeds by Fourier-transform infrared spectroscopy has been done successively (Belanche et al., 2013, 2014). The results have also shown the potential of infrared spectroscopy as an efficient first-line screening tool for monitoring the quality and safety of feed protein materials (Chen et al., 2013).
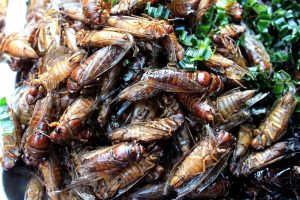
- Analysis of small grain crops including oilseeds and coarse grains – Near-infrared hyperspectral imaging (NIR-HIS) was successfully used for impurity discrimination (straw, broken grains, grains from other crops, weed seeds, insects, plastic, stones, pieces of wood and paintings, animal feces) in cereals (wheat, spelt, and barley) (Dale et al., 2013). Others have used it for discrimination for healthy and diseased maize kernels produced by toxic fungi.
- Analysis of coffee, tea, spices, medicinal plants and aromatic plants, and related products – Infrared spectroscopy not only permits the analysis of the food composition, as in the case of Barbin et al, (2014), in coffee but also allows the general fingerprinting of food to allow the detection of food adulteration and contamination (Ellis et al., 2012; Reis, Franca, & Oliveira, 2013). Near-infrared spectroscopy combined with chemometric tools was utilized as a rapid analysis method to assess quality and to differentiate geographical origins of black tea. The identification accuracy for black tea from different geographical origins reached 94.3%. This study demonstrated that infrared spectroscopy can be successfully applied to rapidly determine the main chemical compositions and geographical origins of black tea (Ren et al., 2013).
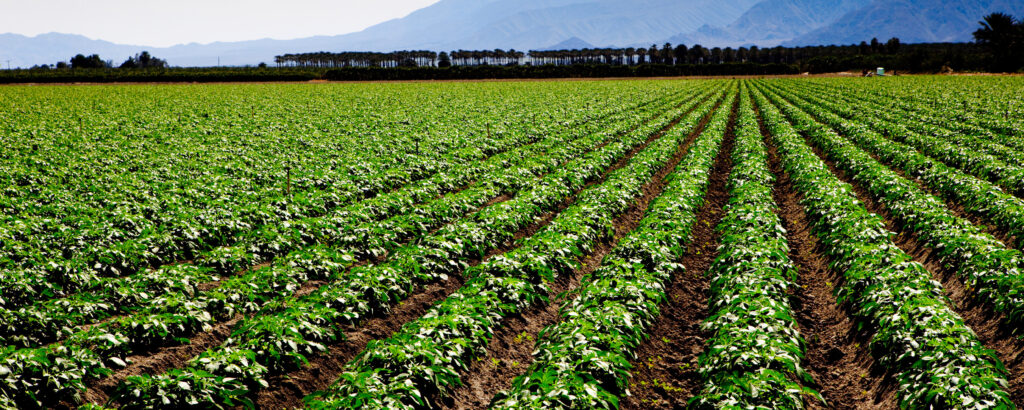
Analysis of fruits and vegetables – Studies on contaminant determination have been conducted on citrus fruits to detect Penicillium fungi, a key cause of fruit spoilage amongst other contaminating bacteria and fungi (Dale et al., 2013). Besides detection of disease causing agents, the hyperspectral technique has also been used to determine the starch index of apples as a maturity parameter for predicting the optimal harvest period (Dale et al., 2013). Prediction of fruit firmness has also been achieved.
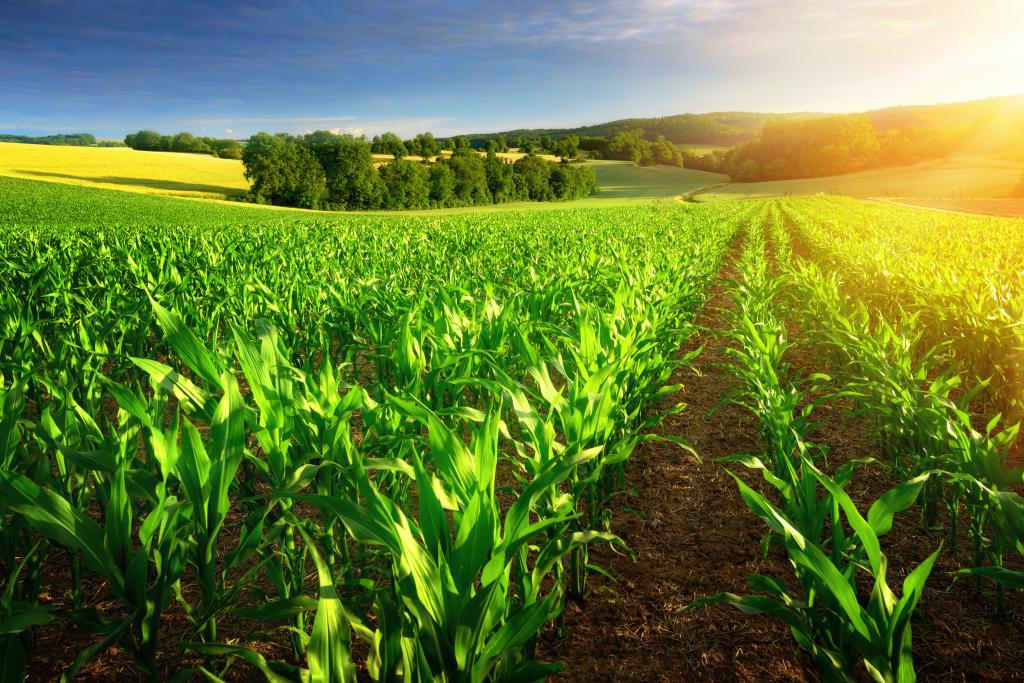
- Vegetation mapping, crop disease, stress and yield detection on farms has also been achieved (Dale et al., 2013). Given such information, an estimate of crop produce is possible.
Applications in analysis of processed foods
- Assessment of food quality and safety – There is growing interest in near-infrared hyperspectral imaging for safety and quality assessments of the agro-food products. For instance, spectroscopy has been applied in detection of adulterants in various food products including honey (Dale et al., 2013).
- Analysis of cereal food products – A near-infrared hyperspectral imaging has been used to differentiate glassy from floury maize endosperm. Near and mid infrared are used to authenticate and trace several cereals (D Cozzolino, 2014).
- Analysis of fats and oils – Edible oils and fats are one of the foods most frequently counterfeited. Therefore, monitoring the authenticity and overall quality of these products is ultimately required. Near, mid and Raman infrared spectroscopy combined with multivariate analysis to authenticate, detect adulteration and determine intrinsic quality parameters in edible fats and oils have been used with success (Nunes, 2014).
- Analysis of dairy and eggs – Researchers have successfully discriminated between different types of cheeses on the basis of the protein, fat, and carbohydrate content. The same technique was also used to discriminate salt and sugar granules. In addition, detection of omega-3 fatty acids in designer eggs has been done (Dale et al., 2013). It’s also possible to detect adulteration in milk and milk products (Botelho et al., 2015; Santos, Pereira-Filho, & Rodriguez-Saona, 2013)
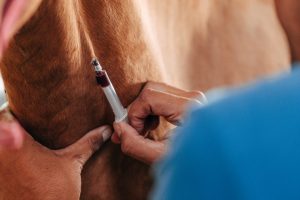
- Analysis of meats – Beef color and tenderness are two major parameters of beef quality. Beef quality evaluation by a trained panel is expensive, time consuming, and difficult to organize. The development of a nondestructive, fast, accurate, on-line technology for predicting beef color and tenderness is therefore highly desirable. Hyperspectral scattering profiles have been useful in assessing beef quality because light scattering from a surface is closely related to product texture. Determination of fatty acids in broiler breast meat by near-infrared reflectance spectroscopy has also been successfully done (Zhou et al., 2012).
Applications in analysis of non-food agricultural products has also been done for the following products:
- Analysis of Timber and Paper
- Analysis of Animal By-Products
- Analysis of Wool
- Analysis of Cotton
- Analysis of Soils
Other Applications of Near-Infrared Hyperspectral Imaging Systems (NIR-HIS) Systems in agriculture
The applications are described by Dale et al., (2013) as follows:
- Use of satellite hyper spectral imaging systems – adapted for agricultural uses, such as determining the physical properties of plant canopies (e.g., leaf size and leaf area index; wavelengths ranged between 400 and 2,400 nm). Many studies focused on the relationship between optical properties and pigment concentration of leaves.
- Use of airborne visible/ near-infrared systems – Whereas satellite data focus on canopy studies, airborne hyperspectral data are restricted mainly to terrestrial vegetation (e.g., canopy, leaf area index, plant diseases, plant production, biochemical parameters). In a study on vegetation community stress, Airborne Visible /Infrared Imaging Spectrometer (AVIRIS) was used to map multitemporal trends; that were strongly correlated and were thus successfully used to predict the biochemical impact and geographical extent of vegetation. Other researchers used the same system to detect tomato stress induced by late blight disease.
- Use of ground-based hyperspectral imaging systems – With this system, the hyperspectral images are taken at the field level, usually by fixing a camera on an agricultural vehicle. It allows field production to be estimated. Researchers have successfully estimated grain sorghum yield variability.
Conclusion
Infrared spectroscopy has demonstrated immense importance in agriculture. Applications range from analysis of growing crop, to their produce as well as the processed products. Its usefulness is far much greater than other chemical methods that are destructive and cannot be used when there is need to conserve the sample. In addition, the tools used are not only fast but highly efficient.